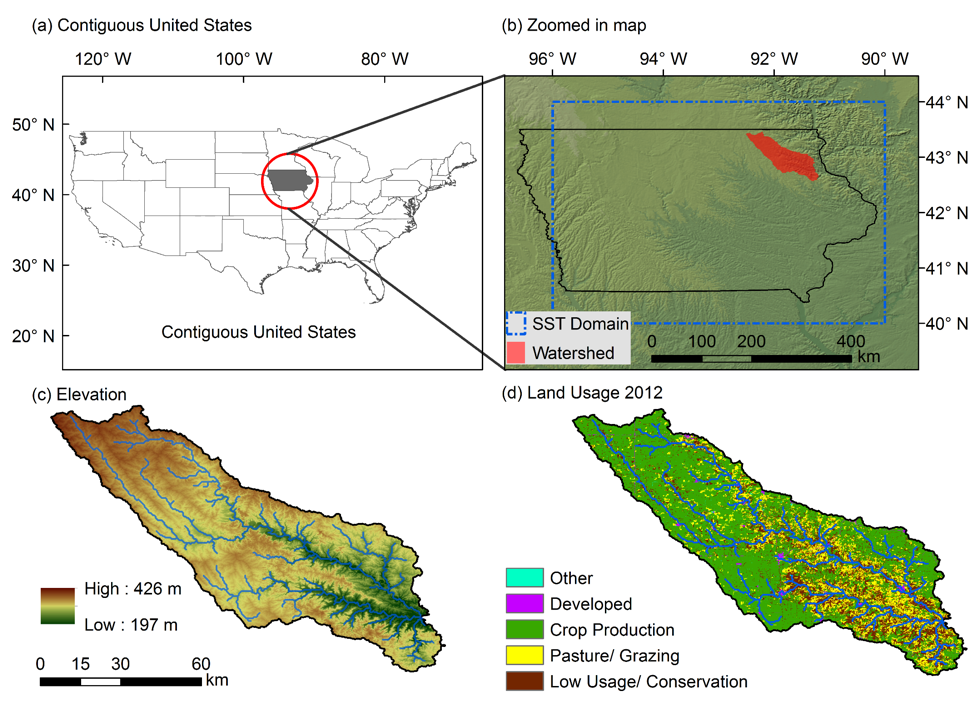
Floods are the product of complex interactions among processes including precipitation, soil moisture, and watershed morphology. Conventional flood frequency analysis (FFA) methods such as design storms and discharge-based statistical methods offer few insights into these process interactions and how they “shape” the probability distributions of floods. We have developed an alternative “process-based” FFA approach that couples remote sensing precipitation, stochastic storm transposition (SST; e.g., RainyDay), and hydrologic model. The methodology is applied to the 4002 km2 Turkey River watershed (Fig. 1) in the Midwestern United States, which is undergoing significant climatic and hydrologic change.
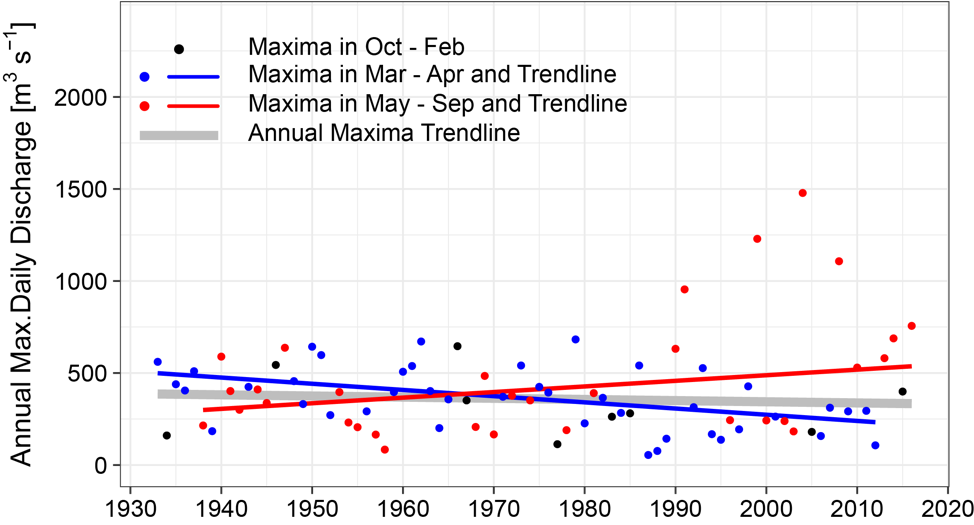
The hydroclimate of Turkey River is changing. Since 1948, annual precipitation and discharge show increases and their variability has also increased, while annual maximum daily discharge has decreased. It is important to note, however, that there are two counteracting seasonal trends (Fig. 2): annual daily discharge maxima have decreased significantly in March-April, but have increased somewhat in May-September. Thus, the lack of statistically significant change in annual maximum daily discharge in Turkey River masks changes in the seasonality of flooding.
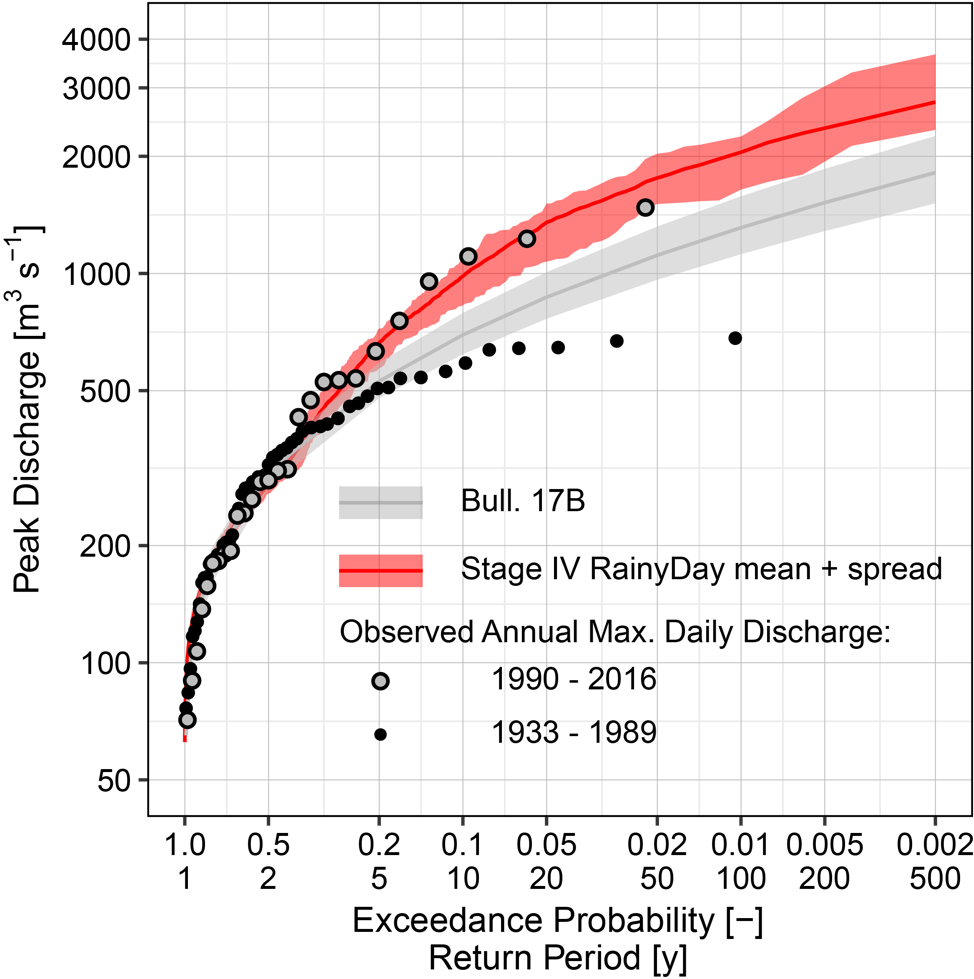
Process-based flood frequency distributions for Turkey River using Stage IV precipitation are compared with the distribution based on statistical analyses of discharge observations using 1933-2016 USGS annual maxima daily streamflows (Fig. 3). When streamflow observations are divided into two groups (1933-1989 and 1990-2016), it becomes clear that the recent peak flood observations align well with the Stage IV-based SST results. This suggests that, despite the relatively short (15-year) rainfall record used, Stage IV- driven process-based FFA adequately reflects flood frequency in the wetter recent climate Bulletin 17B methods based on much longer data records fail to do so.